
")


 a Reliable Indicator for Stock Performance?")


Bite-sized information is a permanent rule of thumb in any social media platform. Businesses’ window of opportunity to get their information out effectively is much shorter than it was a decade ago. With our attention span shrinking to 25% from 12 seconds to eight, it’s a miracle that brands still manage to be engaging, considering all the details they need to share with their audiences.

The equation for social media posts used to be an image (post) + post caption (copy). Algorithms change. It used to be encouraged to keep images text-free to make them visually cleaner on posts. Any information that needs conveying is detailed in its caption. That is no longer the case. Even Facebook scrapped their 80/20 image-to-text ratio. Why? Audiences want the information to be readily accessible. Click on a post, and essential information needed is on screen — not needing to minimize the image, scroll, and click some more to read the caption. And, that is the beauty of infographics.
Social Media Infographics
Different types of content make a social media strategy more effective. Limiting to blog posts, video animations, or the run-of-the-mill aesthetic image with a catchy copy can only engage your target audiences so much before they become disengaged, a.k.a bored of your content.
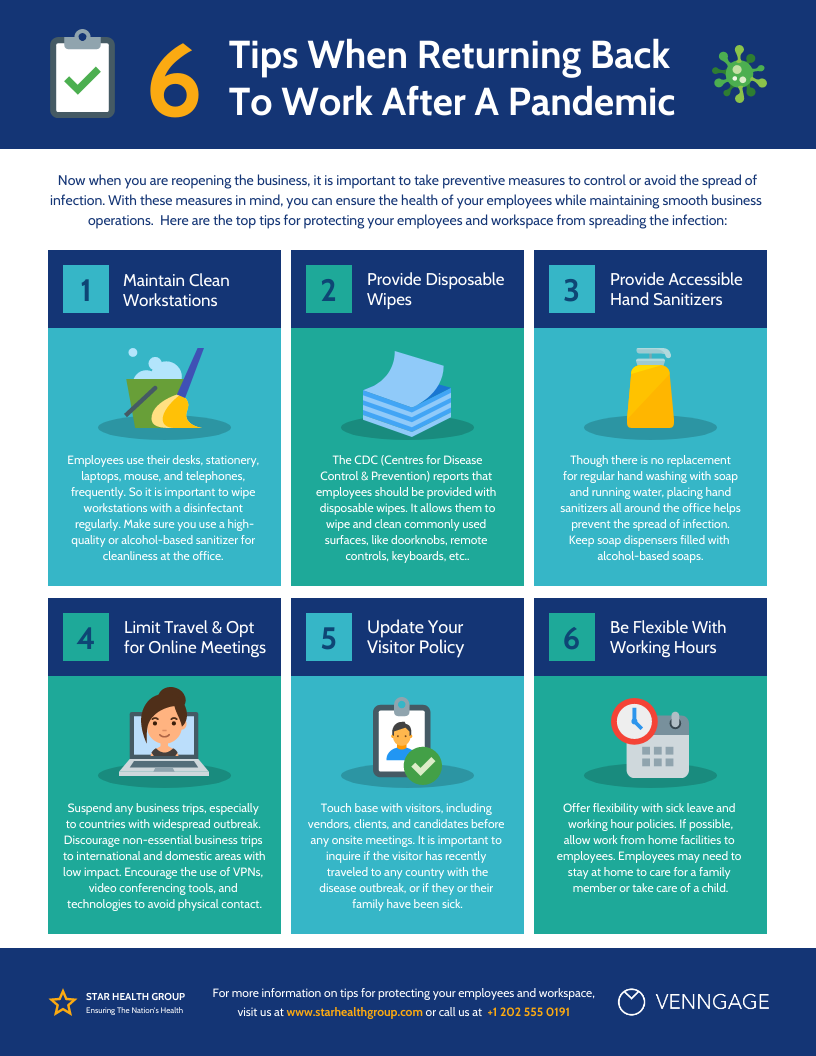
Social media infographics are effective information presentations with more than one visual data in a single content. Yeah, it’s a mouthful. It means that it’s an engaging way of putting visual statistics, charts, diagrams, and icons — to name a few — into one graphic illustration without overwhelming your audiences’ senses.
This is incredibly effective, not to mention nifty, in increasing social media engagement with your audience. Incorporating infographics into your social media strategy is clearly a no-brainer with an understanding rate of 95% and our comprehension speed of a 10th of a second with visual scenes.
How To Use Infographics on Social Media
The end goal is no longer “wowing” the target audience; that’s the initial objective. Instead, it’s maximizing audience engagement. Relaying quickly and effectively crucial information that can influence your audience, and benefit your brand or business is more important. Here’s how:
1. Repurpose content.
There’s only so much original content a brand can produce. Repurposing content is nothing new. Go through your previously published content, such as blog articles, and repurpose it into fresh infographics.
2. Add listicles or how-tos.
These are contents that add value. And audiences gravitate towards this type of content the most. Usable and relevant information is best showcased as an infographic — it’s compact, easy to follow, and fits on most screens without the need to scroll. Easy to download and save, too!
3. Make content teasers.
Need to keep your audience on their toes? Using infographics as content teasers is a great way to utilize white space within a design. Okay, infographics do not mean you have to flood your design with different visual elements. An uncluttered, balanced graphic-and-text design with need-to-know content is a great way to use infographics as a content preview or teaser.
How to make infographics
Admittedly, it’s a bit trickier to create infographics compared to the standard flyer or social media post. Because it has more than one visual data component, there’s an extra step or two with the traditional process.
1. Identify your target audience.
The reason why this is always the first step in any advertising or marketing content creation is because different sets of audiences respond to different types of information. Having an insight of your target audience’s sentiments or motivations enables you to create more effective infographics.

2. Collate your information.
What information do you intend to showcase in your infographics? Depending on your goal, this can vary from tips and listicles, statistics and analytics, or process flow on maneuvering your brand’s product or services. Whatever your infographics’ goal is, take the time to ensure that your information is complete, credible, and easy to digest when converted into visual graphics.
Select your type of infographic.
There are at least 10 different types of infographics. And that’s only the most commonly used ones. The type of infographic that you choose determines the overall flow and layout, as each type of infographic has its particular way of displaying data and information.
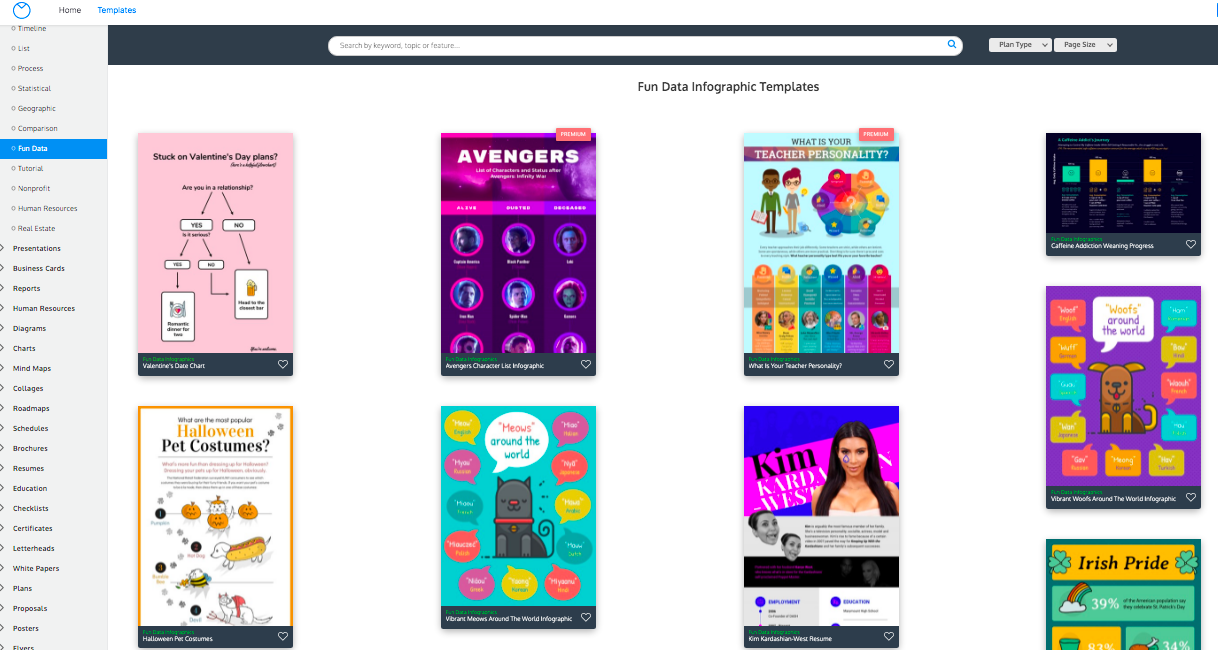
However, if you use an online infographics maker, this step takes about five seconds to do, and you can altogether skip steps #4 and #5 below! Cloud-based design solutions like Venngage have 12 different types of infographics and hundreds of premade templates to suit your objective. It’s super easy to use, and you have the option to utilize free templates or upgrade to access premium designs. You can visit their website to find out more or click here to be directed to the infographics page.
Create a sensible structure of your data.
Feel free to skip this and the next part entirely unless you’re creating your infographics manually (why!). Organizing your information hierarchy is as crucial as telling a story in the right sequence — none of that 500 Days of Summer plot where it gets confusing which scene comes after which.
Here’s how to structure your infographics data:
- Create an outline of the main points.
- Talk through the outline to give you a preview of how it appears to your audience.
- Adapt the Z-pattern: audiences tend to read information from left to right, descending diagonally, then right.
Jazz up your design.
A fair warning was given earlier: it’s not easy designing the best infographics. So, unless you are using a premade template from Venngage, it helps if you have a graphic artist who can help you customize or jazz up your design.
From adjusting the colors to suit your brand’s standards, to tweaking icons to represent a more explicit message, or simply moving elements around, ensure that your overall structure is undisturbed so as not to disrupt your infographics’ message flow.


